Hi everyone!
At Kiwibot we build sidewalk delivery robots. While our project gets more and more complex, the importance of keeping a complete, functional, and updated documentation grows by the day. In order to make our engineers’ life easier and happier (nobody enjoys writing documentation) we decided to create an open-source tool for generating software architecture documentation for ROS2 systems. Today, we are introducing ros2-graph, a PyPI package to generate mermaid descriptions of ROS2 graphs to add to your markdown files!
A tool with a similar purpose is rqt-graph but it does not include services/actions and adds some non-required information when we filter by a node. Normally the workflow includes connecting to a terminal where the ros system is running, launching the rqt-graph, saving the resulting image, and uploading it to the cloud to include it in the documentation.
While we used rqt_graph for grasping our system architecture at runtime, we were still missing a tool to create simpler per-node graphs, that would look more interactive and understandable in our documentation than the images we may have taken from the former. We decided to use mermaid because it can be saved as a text snippet in your markdown but will be rendered beautifully and colorfully in your favorite web based git repository.

Generating a graph using ros2_graph

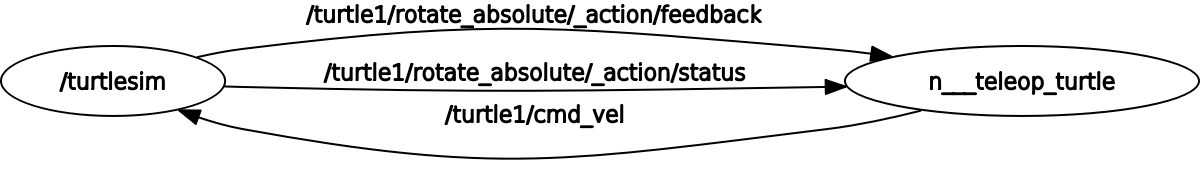
Ros2_graph outcome
Rqt_graph from the same nodes.
Credits to @garzonwilmer5 and @charlielito who developed this tool.
Hope you find this tool useful. We are more than happy to receive feedback from the community!